// Figure 01 Testing showed that comrehension was significantly enhanced when applied to data rich content.
The Global Slavery Index contains data on 167 countries — prevalence, government response, vulnerability, population enslaved. The challenge: make it legible to both policy experts and lay audiences, across every device. We used color, size, and progressive disclosure to condense density into clarity.
The 2014 Global Slavery Index website was built to illuminate a fact many people don't want to confront: slavery still exists in the modern world, and the number of people currently enslaved is enormous.
The site needed to serve wildly different audiences:
All of them. On desktop, tablet, and mobile. Without compromising the data.
Numbers in tables alone are difficult to understand. Density obscures meaning. But stripping data out loses the rigor that makes the Index useful to policymakers.
We leaned on the full toolkit of visual hierarchy — leveraging long-established graphic design fundamentals (color, size, proximity, contrast) alongside digital-native patterns (progressive disclosure, responsive collapsing, filtered views).
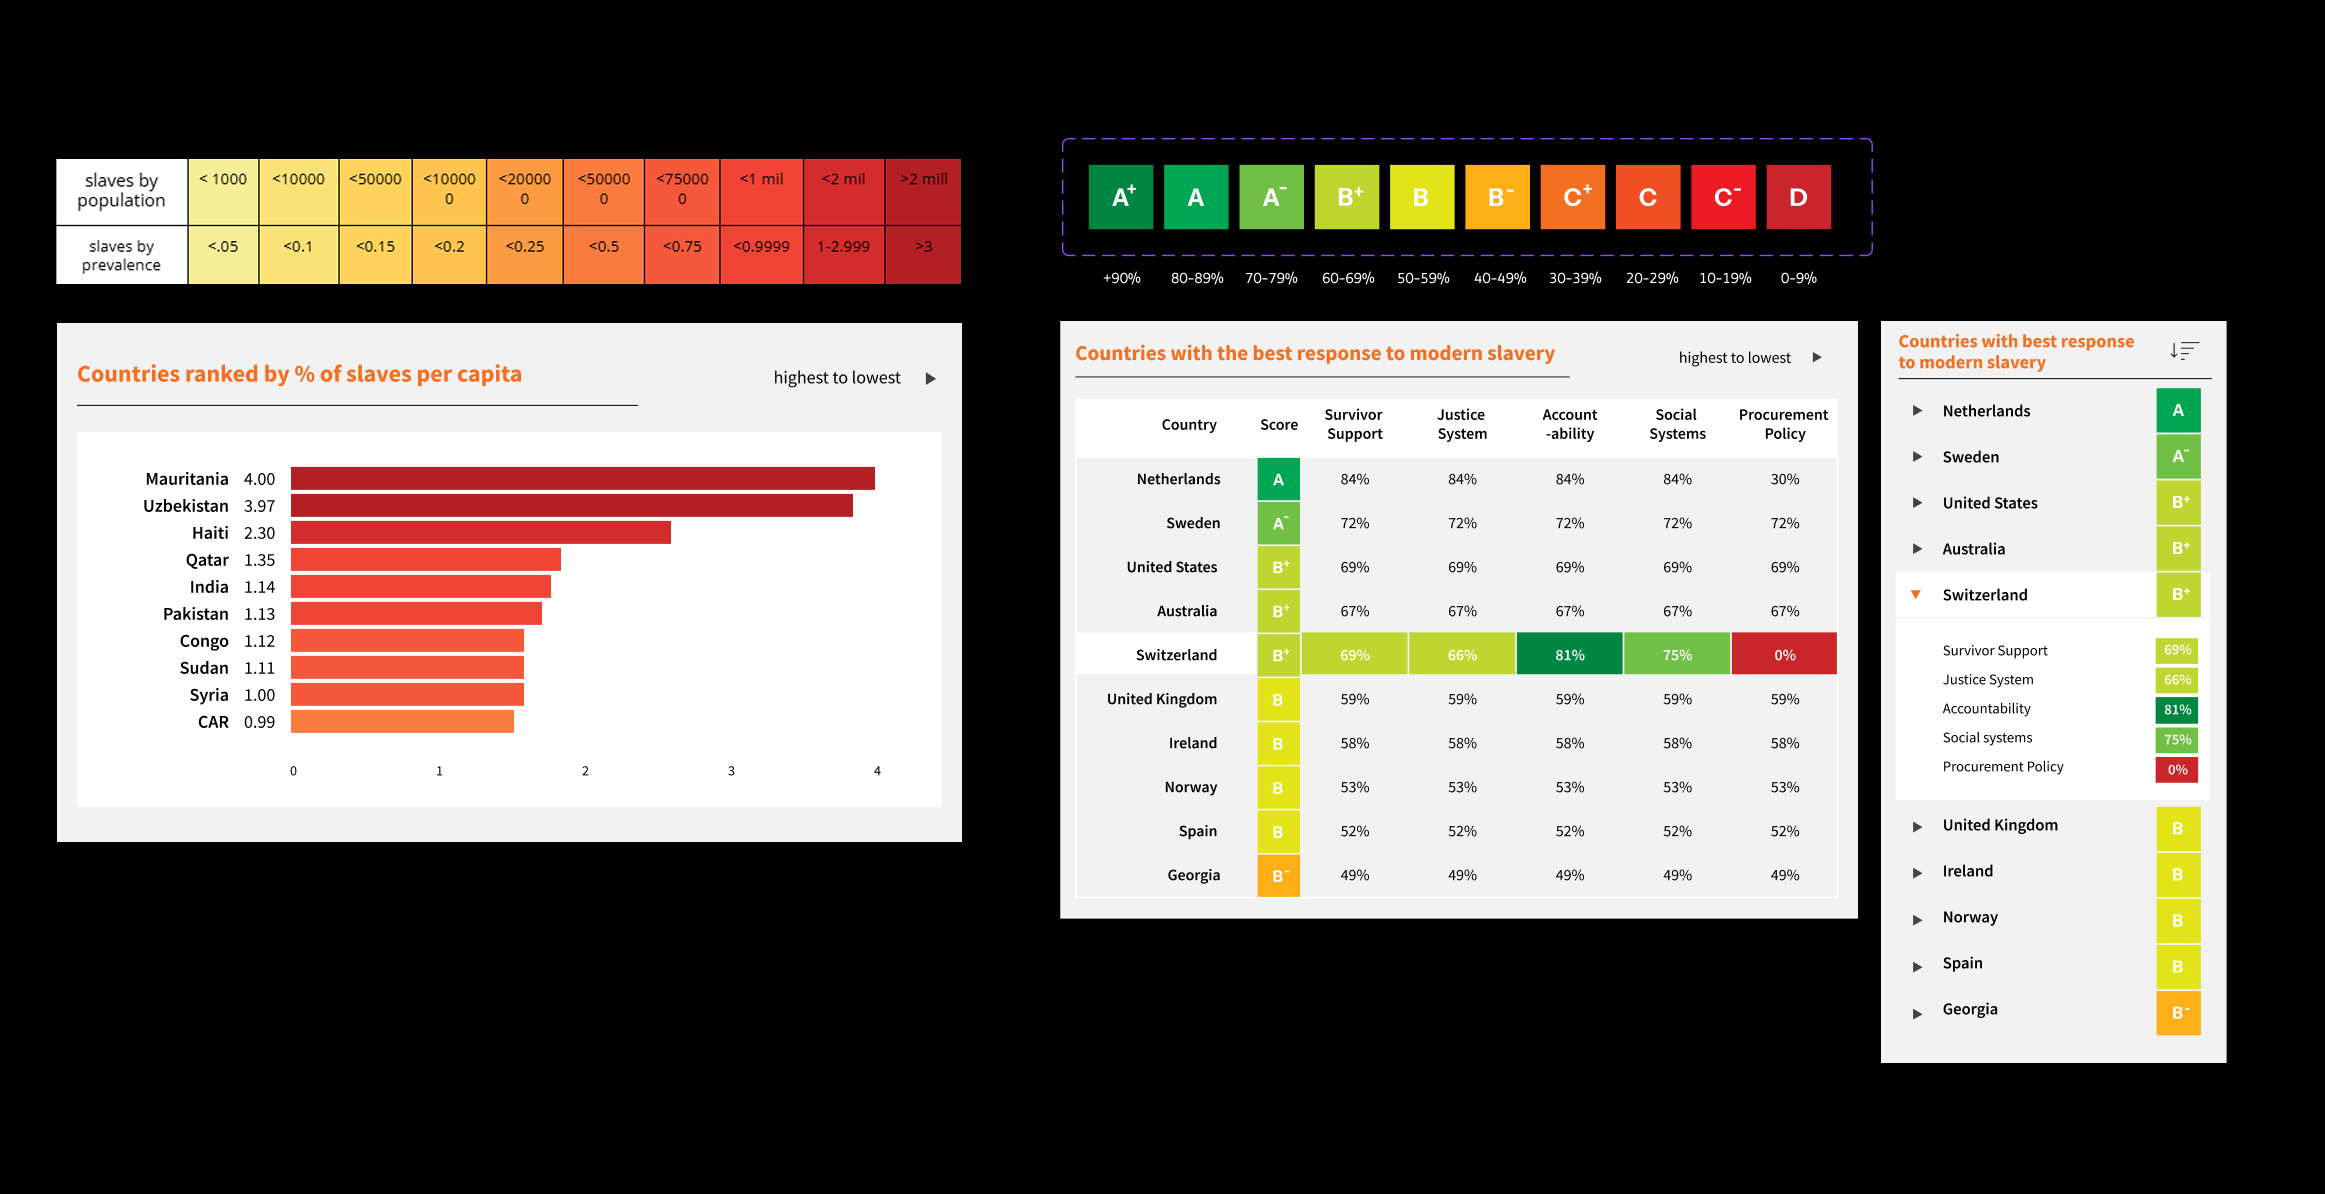
Each country was assigned a letter grade from A+ to D based on government response strength — an intuitive signal lay audiences understood instantly. Underneath it, the full breakdown was available for experts: survivor support, justice system, accountability, social systems, procurement policy.
Prevalence data (slaves per capita) was shown using an interactive horizontal bar chart. Color encoded relative severity — dark red for highest concentrations, lighter tones descending. Clicking a country name pulled up the complete country profile. One visualization, three levels of engagement: glance, compare, deep-dive.
Response data had more variables than a bar chart could carry, so we used a sortable matrix — rows of countries, columns of response criteria, each cell color-coded by strength. On mobile, the matrix collapsed into a letter-grade-first view, revealing detail progressively as users tapped through.
The site launched with 500+ global media references, far surpassing its reach goals. It was featured on data-visualization platforms including visual.ly and The Guardian, cited by policymakers, and used as teaching material in human rights courses.
In 2024, the project won the Anthem Award for its data, design, and collaboration in shining a light on modern slavery and empowering change-makers.
Judges commended the project's scale, complexity, and impact in transforming understanding of human rights violations — providing evidence for policy.
Ten years after launch, the Index remains a reference point for how complex international data can be rendered accessible without being dumbed down.